
Explore your data through rich visual analytics, interactive graphs, reports, and statistical analysis. Quickly perform powerful calculations, overlap and visualize various data sources on a single map, apply geo-analytics, spot trends, patterns, and more.
Empower your decision making with data-driven insights.
GET A DEMO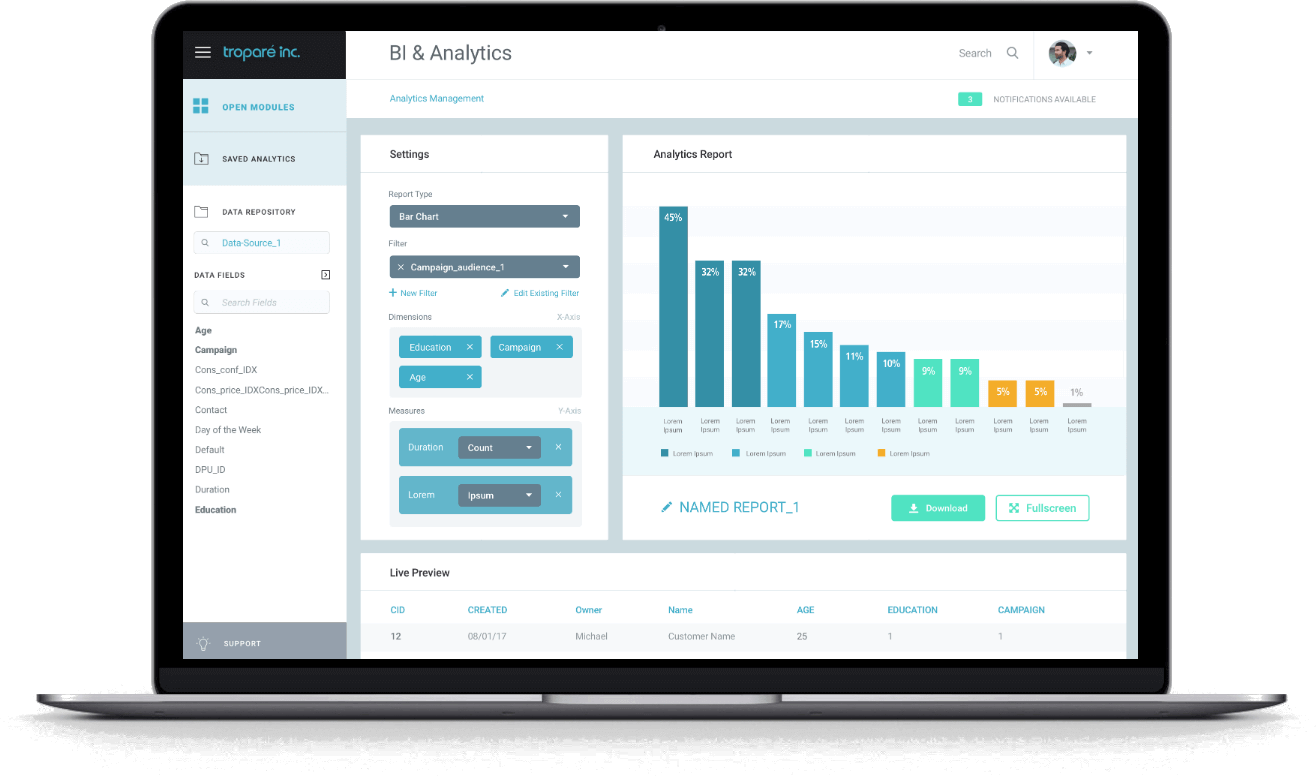
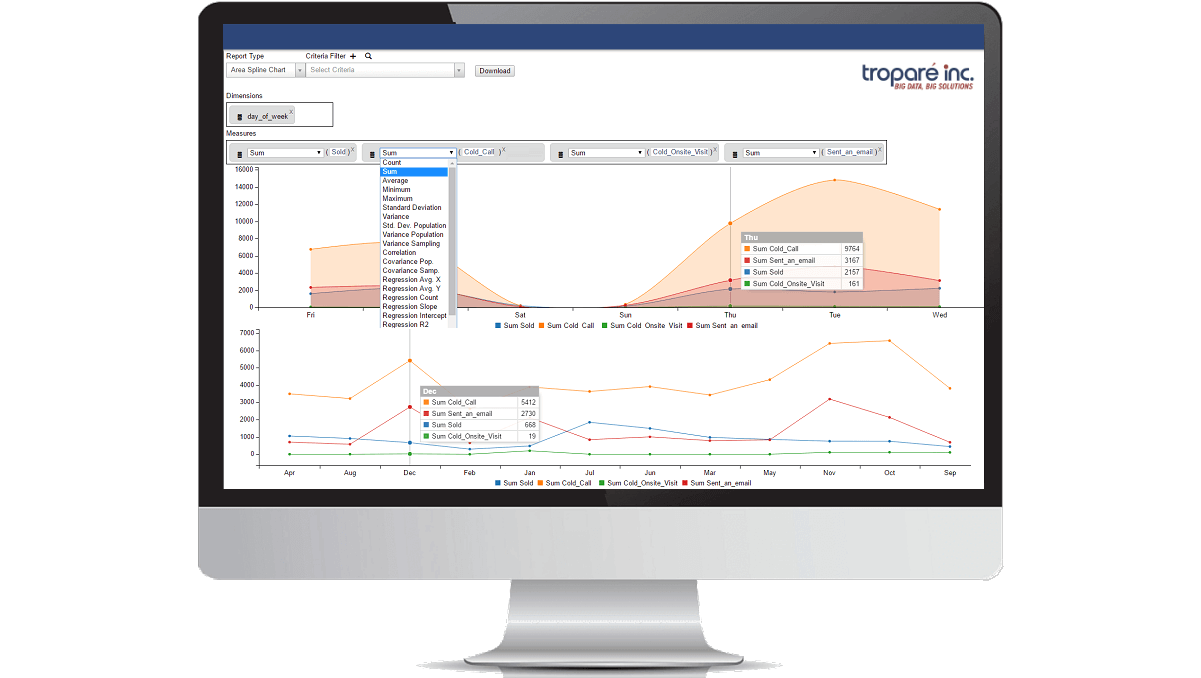
More than just elegant visualizations, dig deep with a vast array of built-in statistical tests, analyses, and calculations to assure strategic decision making.
Effortlessly create an unlimited amount of custom criteria filters to concentrate your analyses on specific (sub)-segments of data, compare cluster results, magnify detail levels, and more.
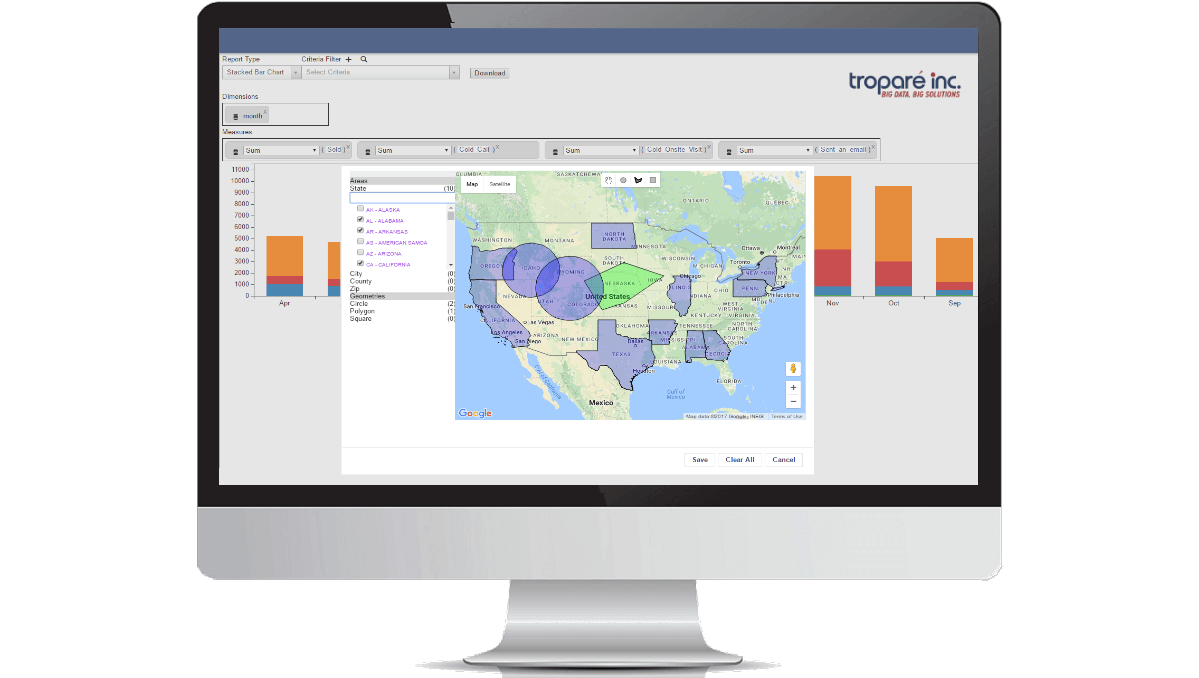
Choose to analyze and present your data in a variety of different ways – from interactive maps with custom geocodes and territories, to (area) spline, stacked bar, heatmaps, bubble charts, pie charts, and more.
Easily track, manage, and review company – department – and individual performance levels in a visual and interactive interface. (Customizable data source permissions)
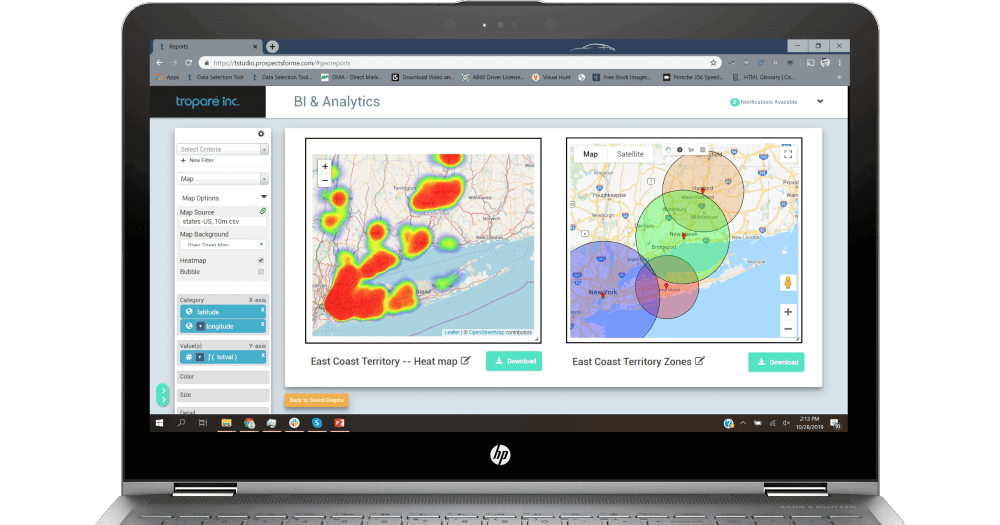 Troparé's geo-analytics facilitate interactive mapping of geospatial data to visually reveal insights, patterns, and trends otherwise not easily interpretable through standard pivot tables, graphs, or charts.
Swiftly combine and visualize disparate data assets on a single cartographic canvas which includes different mapping, filtering, and geospatial highlighting & colorings for optimal and swift interpretation of geo-related insights.
© TROPARE INC. 2014-2022 ALL RIGHTS RESERVED.